Dana Tabaza has her eyes on a possible consulting career once she graduates from the University of Wisconsin-Madison in a few years. The sophomore is double majoring in industrial engineering and data science while also picking up a certificate in business, a combination she figures will prepare her for fast-paced, nimble work. She joined the Wisconsin Consulting Club in fall 2021 to learn more about the field and connect with other interested students.
And when she’s told her older industrial engineering peers in the student organization about the topics she’s learning in ISyE 210, Introduction to Industrial Statistics, during the fall 2021 semester, they’ve been quick to offer some simple advice: Make sure you listen closely during those lectures!
Turns out, the statistical methods on Tabaza’s course syllabus are some of the same ones her peers have used in their co-ops and internships.
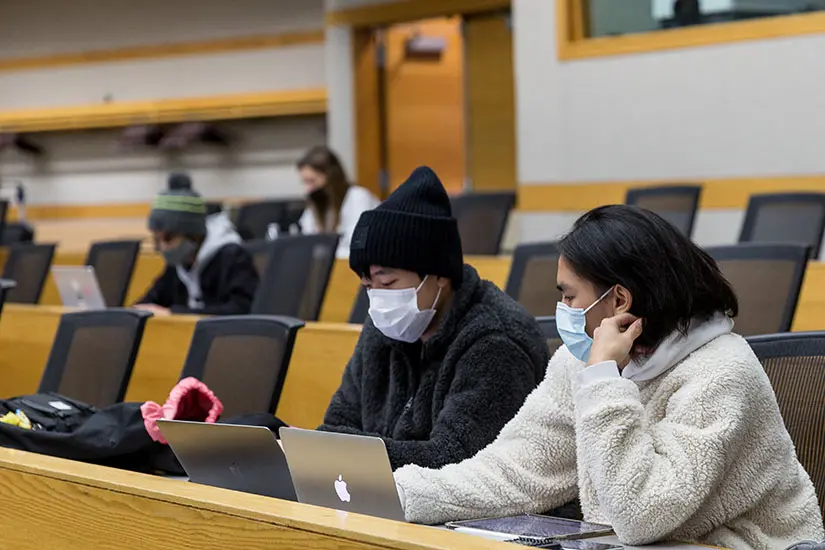 Students collaborate on a problem during a class session.
“A chunk of being a consultant is being able to analyze and look at data and make good decisions from the data,” says Tabaza, who grew up in the country of Jordan before moving to Wisconsin and attending high school at Brookfield Central.
Learning statistical fundamentals and then applying them to solve tangible problems is precisely the point behind ISyE 210, the Department of Industrial and Systems Engineering’s new engineering analytics course. Statistics, course instructor Amanda Smith notes, “is really just a more boring word for data analytics,” an ever-sprawling set of practices that are increasingly informing every field.
ISyE developed the course with input from across its faculty, ensuring the content includes the fundamentals students will build upon in subsequent classes as they sharpen the focus of their studies. ISyE 210 is being offered for the first time in fall 2021, initially just for ISyE students to fulfill a statistics requirement. But by spring 2022, it will be open to all engineering students, giving them an introductory dive into analytics that’s more closely tailored to their future careers.
“We wanted to create a course that would give that fundamental training in a practical, hands-on way that would be meaningful and relevant to engineering students,” says Smith, who is ISyE’s associate chair for undergraduate affairs. “Instead of just formulas and theory, we focus on topics like, ‘Here’s how we use statistics. Here’s the practical, day-to-day reality of working with data. It’s messy; you don’t always know if it’s what you really need. Here’s how you begin to understand what your data is telling you and how you can use it well.’”
In the course, advanced first-year students and sophomores learn the basics of probability, a range of data tools in Microsoft Excel, and statistical techniques like linear and multiple regression. By the end of the semester, they’ll have tackled a case study covering statistical quality control, a classic industrial engineering assignment.
And throughout the fall, they’ve worked on their team projects, applying methods learned in class to datasets of their choosing from an expansive list culled by Smith from the public data science repository kaggle.com. Project topics in fall 2021 range from analyzing the characteristics of the most-streamed songs on Spotify to pinpointing the population characteristics that best indicate whether a tumor is likely to be malignant in breast cancer diagnoses. Tabaza’s team opted for a lighter topic, applying regression methods to study the physical characteristics of opossum populations.
Smith has also infused diversity, equity and inclusion into the project, devising an optimization model to maximize diversity while matching students into teams of four based on voluntarily reported demographic information (ensuring students from underrepresented minority groups weren’t the only ones on a given team), skill levels and years in school. The course also covers statistical studies that demonstrate that diverse teams are more effective than homogenous ones, showing students both the analysis and the results.
“Any class will show you examples using formulas,” says Smith, “but I hope this class shows relevant examples that students can easily understand and see why statistics is important and make it accessible, make it something that they care about learning.”